
EURUSD Wyckoff Distribution Schematic
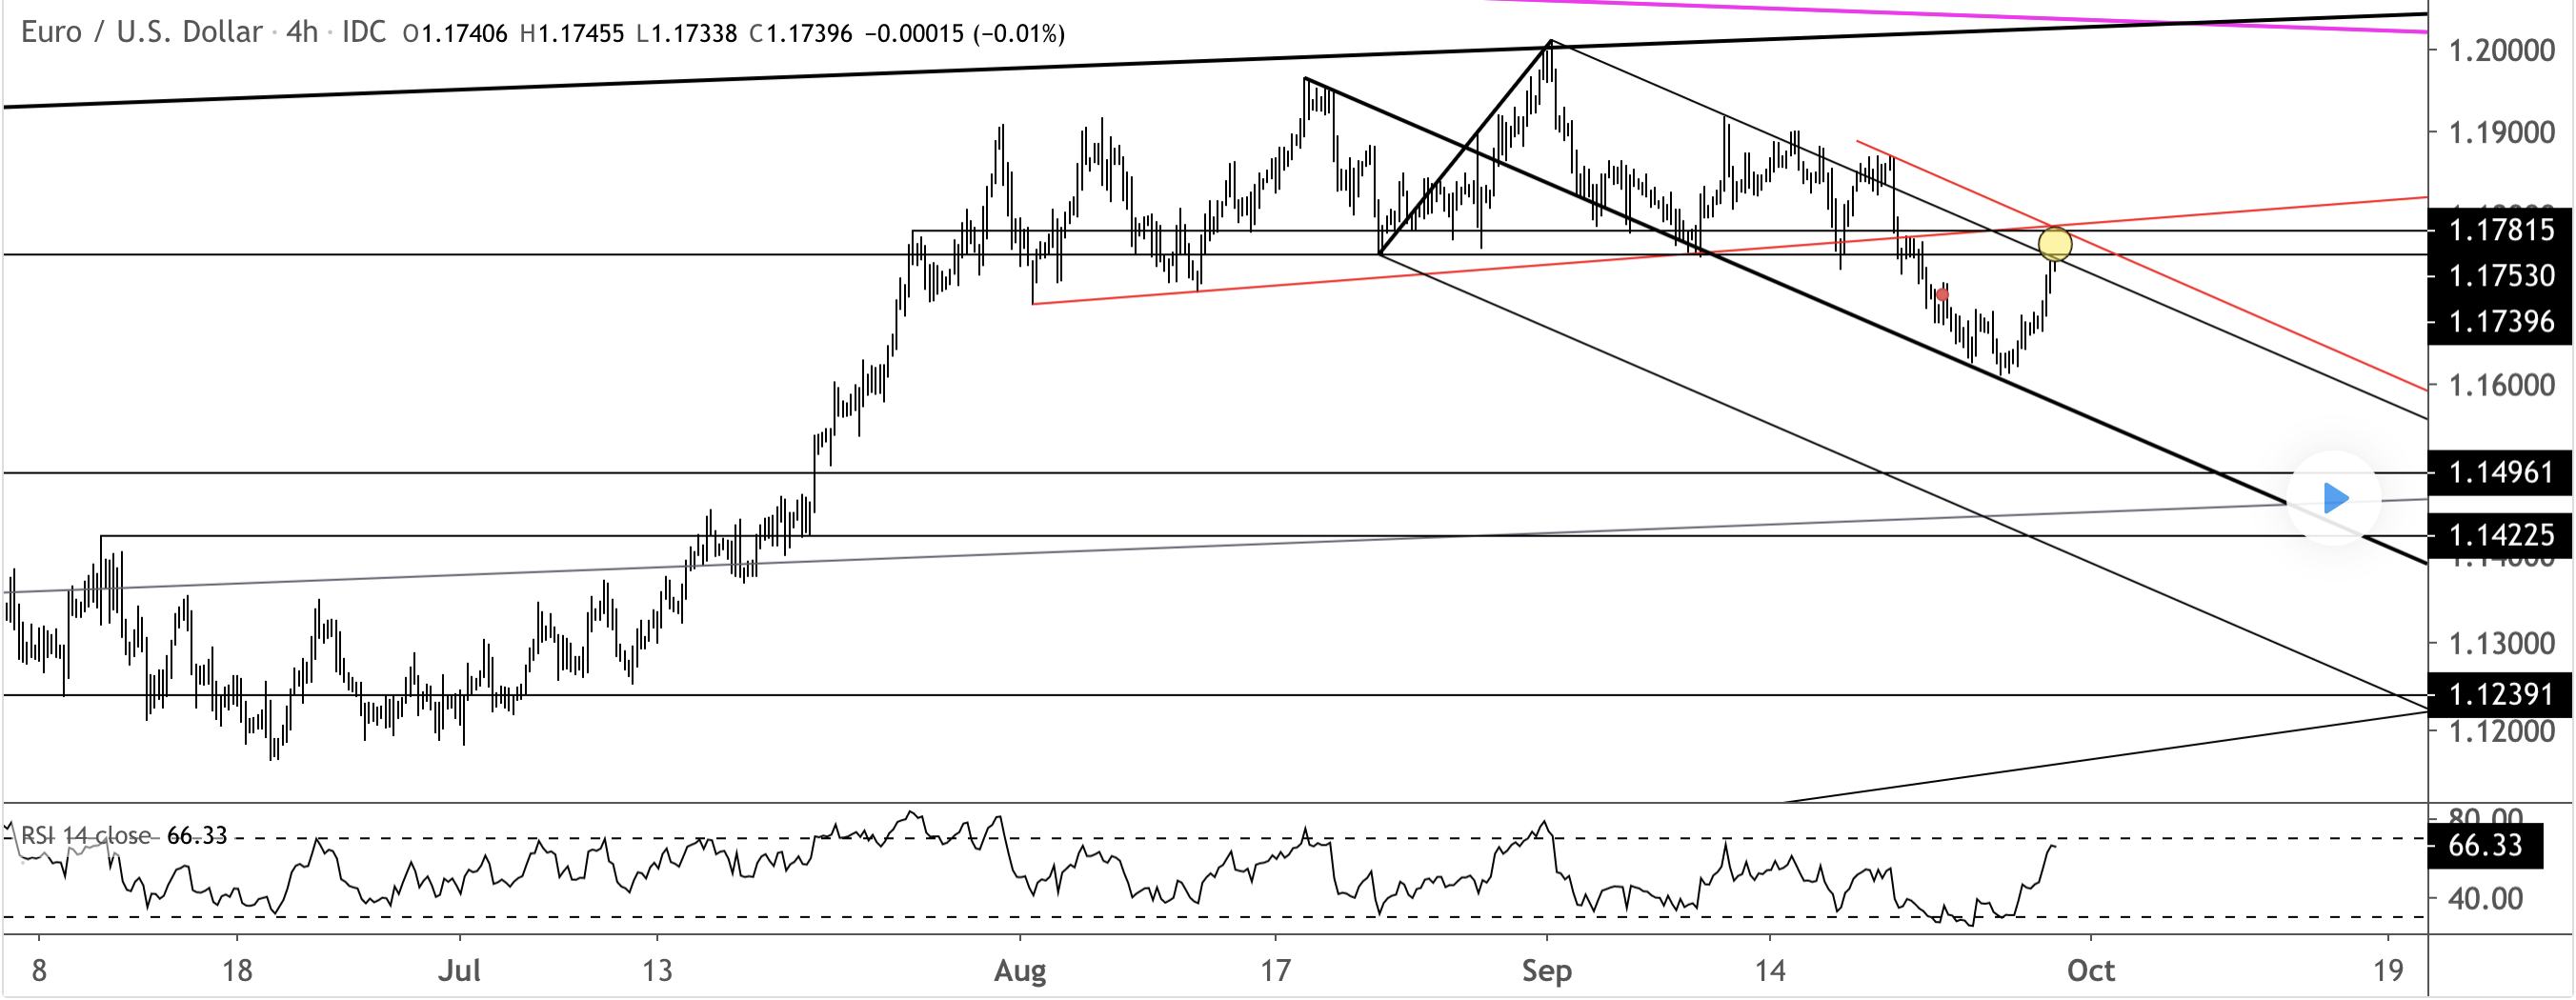
We last looked at the Wyckoff Distribution Schematic on 9/14. To review:
I’m showing a Euro futures chart because volume must be incorporated when analyzing a market from a Wyckoff perspective. Volume on SOW (sign of weakness) days are highlighted with yellow circles. Notice how volume expanded into the BC (buying climax) and decreased on the ST (secondary test). A drop below 1.1750 is required in order to complete the distribution.
#EUR/USD#
免責事項:本記事で述べられている見解は著者の見解のみであり、Followmeの公式見解を反映するものではありません。Followmeは、提供された情報の正確性、完全性、信頼性について一切責任を負いません。また、書面で明示的に記載されている場合を除き、本記事の内容に基づいて行われたいかなる行動についても責任を負いません。