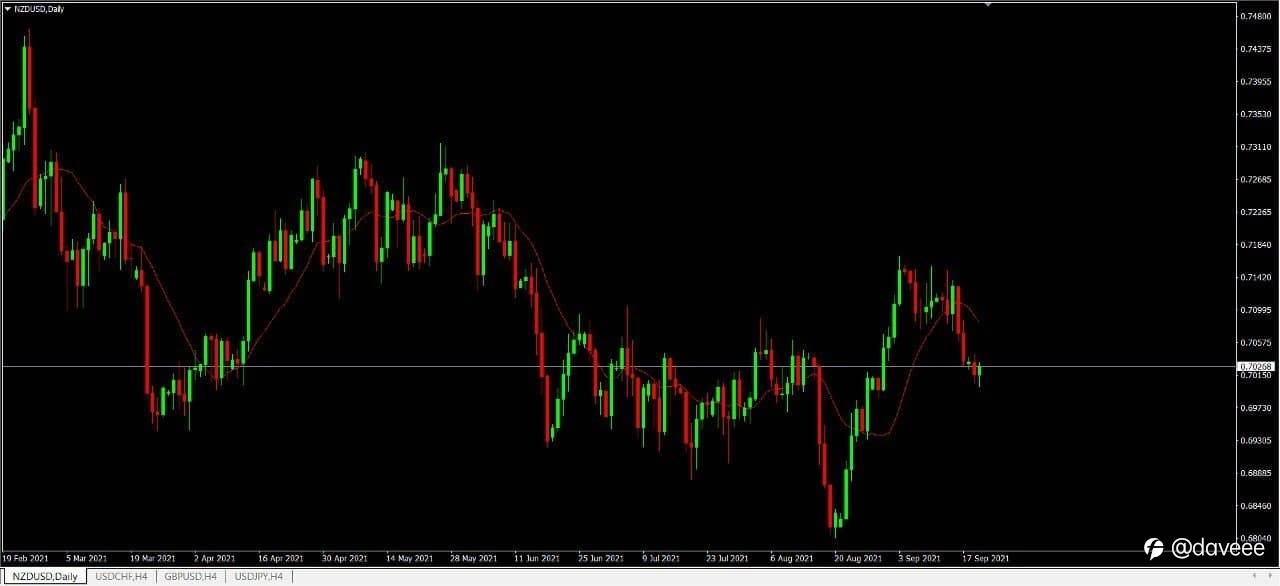
NZD/USD DAILY CHART ANALYSIS
Always keep track that a head-and-shoulders position materialized in the first quarter of 2021 as NZD/USD slipped below the 50-Day SMA (0.7006) this is the first time this has happened since November, with the exchange rate pushing below the 200-Day SMA (0.7116) for the first time since June 2020 to trade to a fresh yearly low (0.6805) in August.
Although, NZD/USD reversed course ahead of the November 2020 low (0.6589) among the failed attempt to close below the 0.6810 (38.2% expansion) region, with a bull flag formation taking shape earlier this month as the exchange rate cleared the July high (0.7105).
☎️ Telegram : https://t.me/MU_I09
📧 Email: [email protected]
#cpt #cptinternational #gold #forex #crudeoil #currency #investment #stock #mt4 #tradingapp #trading #technicalanalysis #USD #NZD @CPT International
免責事項:本記事で述べられている見解は著者の見解のみであり、Followmeの公式見解を反映するものではありません。Followmeは、提供された情報の正確性、完全性、信頼性について一切責任を負いません。また、書面で明示的に記載されている場合を除き、本記事の内容に基づいて行われたいかなる行動についても責任を負いません。

古いコメントはありません。ソファをつかむ最初のものになりましょう。