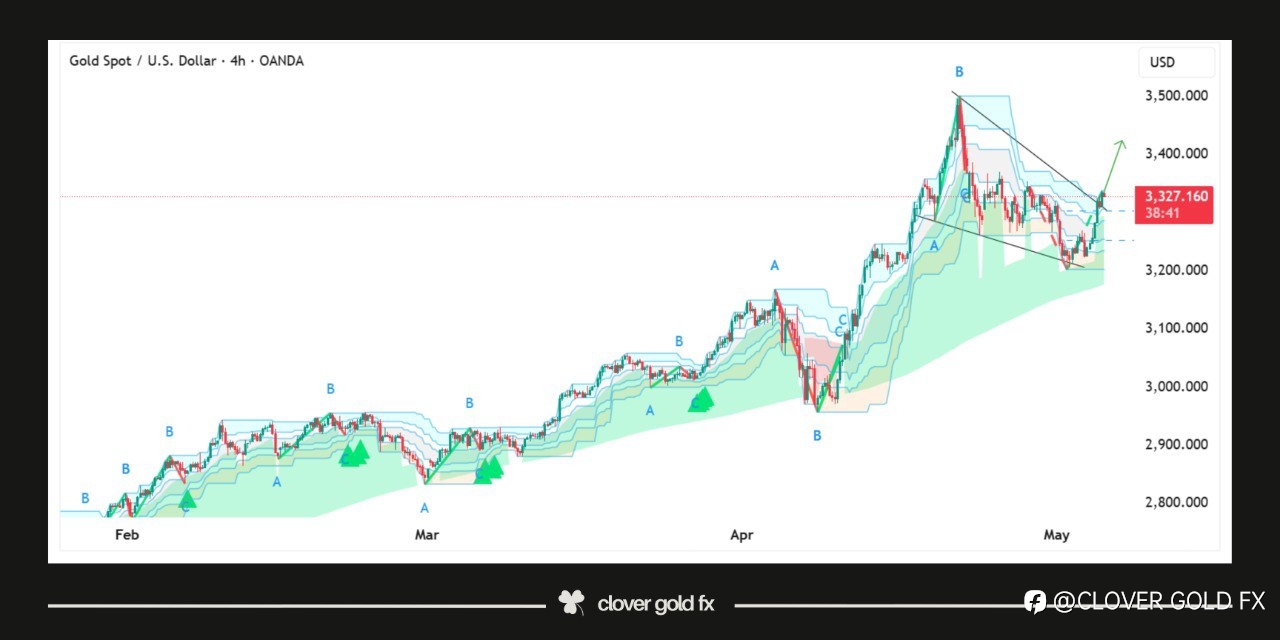
The 4H XAUUSD chart illustrates a completed five-wave impulsive structure followed by a classic ABC corrective pattern, consistent with Elliott Wave Theory. The initial impulse (waves 1 through 5) reflects strong bullish momentum likely driven by escalating inflation concerns and persistent geopolitical tensions that spurred safe-haven demand for gold. Post wave 5, a corrective decline unfolded in a downward-sloping channel forming waves A, B, and C, signaling temporary profit-taking and consolidation as markets priced in expectations of a potential Fed pause. The correction completed at wave C, setting the stage for a new bullish impulse where wave 1 initiated the reversal, wave 2 provided a shallow retracement, and the market has now progressed through wave 3 with wave 4 forming a minor pullback. We anticipate the final wave 5 to target the prior resistance zone near as fundamental support grows from recent weak U.S. macro data and increasing speculation around rate cuts, adding fuel to renewed bullish sentiment in gold.
免責事項:本記事で述べられている見解は著者の見解のみであり、Followmeの公式見解を反映するものではありません。Followmeは、提供された情報の正確性、完全性、信頼性について一切責任を負いません。また、書面で明示的に記載されている場合を除き、本記事の内容に基づいて行われたいかなる行動についても責任を負いません。
古いコメントはありません。ソファをつかむ最初のものになりましょう。