


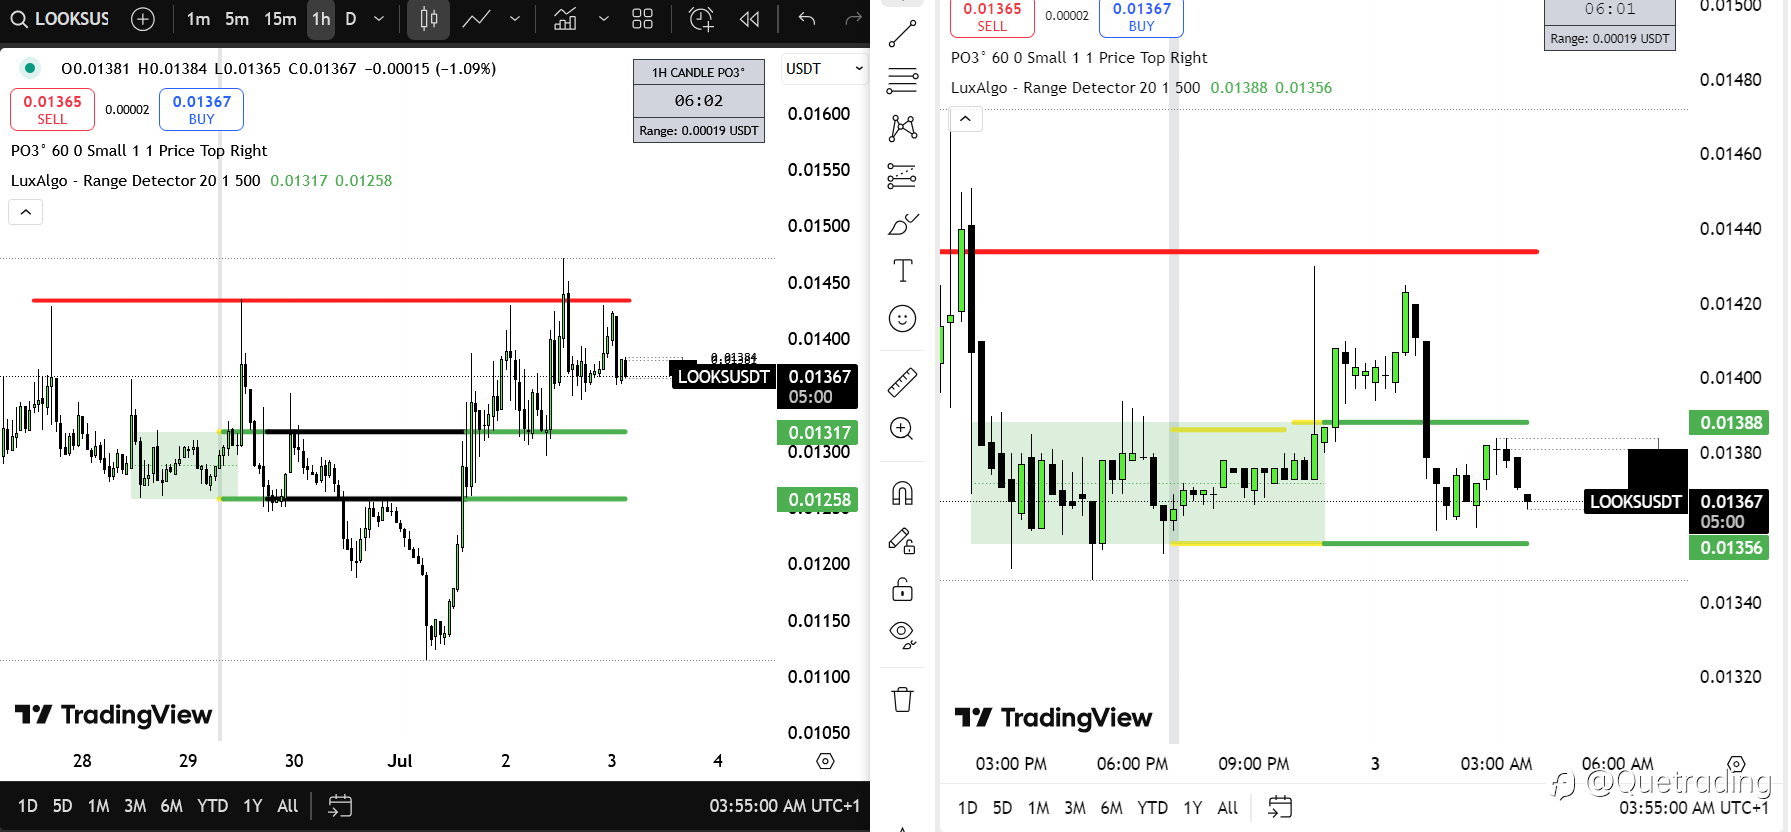
LOOKSUSDT 🕐 1H Chart (Higher Timeframe View):
Price is currently hovering below a key resistance zone marked by the red line. There's potential for price to rotate back down into the previously broken support zone (highlighted rectangle) around the 0.01317–0.01258 area. This area may act as a demand zone if price returns, so I’m watching for possible reactions there.
⏱️ 15M Chart (Lower Timeframe View):
As I’m typing, price is trading inside a smaller rectangle (former support on the 15M) between roughly 0.01388 and 0.01356. This range could offer quick scalping opportunities depending on how price reacts at the edges. Watching closely to see if price respects this zone or breaks down for a deeper retrace into the higher timeframe support.
Patience until the reaction at these levels tells the next move. ⚔️📈
03 Jul 2025, 11:04 を編集しました
免責事項:本記事で述べられている見解は著者の見解のみであり、Followmeの公式見解を反映するものではありません。Followmeは、提供された情報の正確性、完全性、信頼性について一切責任を負いません。また、書面で明示的に記載されている場合を除き、本記事の内容に基づいて行われたいかなる行動についても責任を負いません。

