Setup Failed.
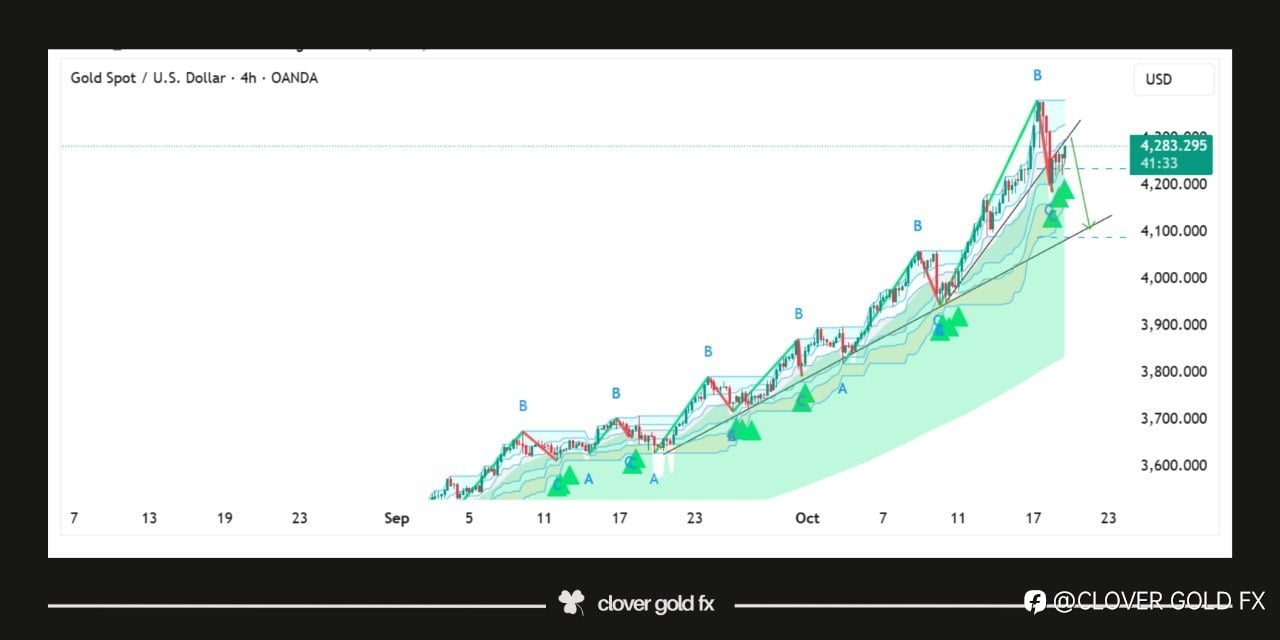
From a technical perspective, gold’s surge on October 20, 2025, was supported by a strong bullish breakout above the previous resistance zone near $4,150 per ounce, confirming a continuation of the uptrend that had been forming since early Q3 2025. The move was accompanied by high trading volume and a bullish crossover on major momentum indicators such as the MACD and RSI, signaling strong buying pressure. The price also remained well above key moving averages particularly the 50-day and 200-day EMAs which acted as dynamic support levels. In addition, a weakening U.S. dollar index (DXY) and falling bond yields further reinforced the bullish technical setup. Together, these factors created a confluence of technical signals that drove gold to a new all-time high around $4,300 per ounce during that week.
21 Oct 2025, 01:35 を編集しました
免責事項:本記事で述べられている見解は著者の見解のみであり、Followmeの公式見解を反映するものではありません。Followmeは、提供された情報の正確性、完全性、信頼性について一切責任を負いません。また、書面で明示的に記載されている場合を除き、本記事の内容に基づいて行われたいかなる行動についても責任を負いません。

古いコメントはありません。ソファをつかむ最初のものになりましょう。