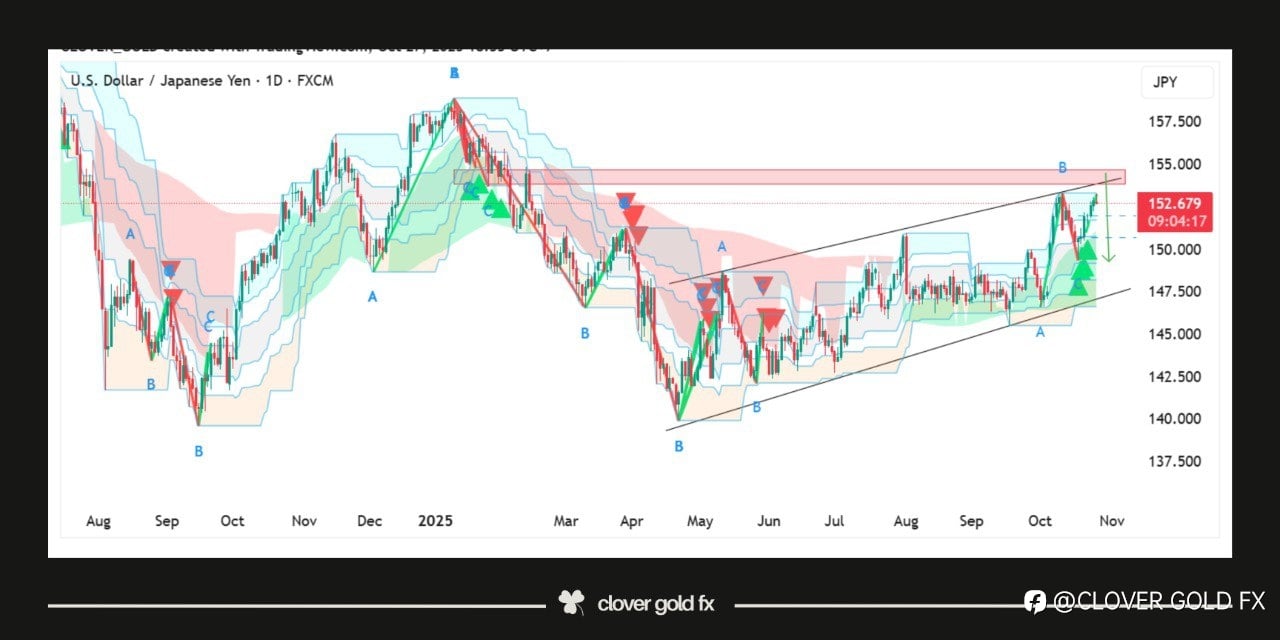
USDJPY shows a bearish setup on the daily chart as the pair has reached the golden Fibonacci resistance level and started to face strong rejection from that zone the structure forms an ending diagonal pattern suggesting potential downside pressure the highlighted red arrows indicate a possible drop as price completes the final wave E of the pattern momentum is losing strength near the upper trendline confirming the likelihood of reversal sellers may take control soon leading to a downward correction toward the lower boundary of the channel this setup reflects a shift from bullish exhaustion to bearish momentum in the coming sessions
免責事項:本記事で述べられている見解は著者の見解のみであり、Followmeの公式見解を反映するものではありません。Followmeは、提供された情報の正確性、完全性、信頼性について一切責任を負いません。また、書面で明示的に記載されている場合を除き、本記事の内容に基づいて行われたいかなる行動についても責任を負いません。

古いコメントはありません。ソファをつかむ最初のものになりましょう。