


** 🟡 Gold Analysis (4H Chart)*
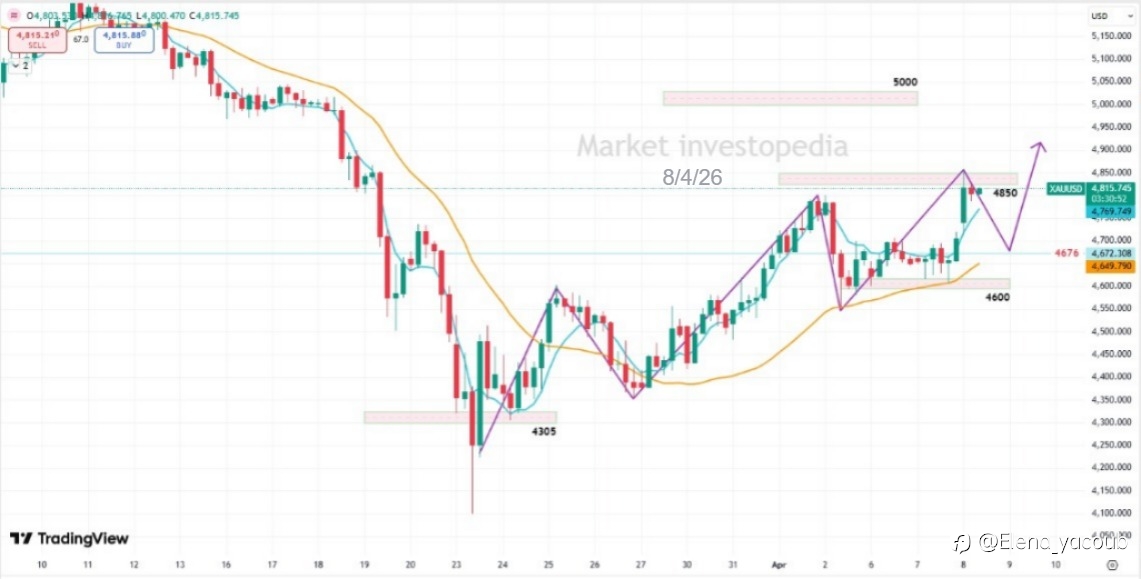
🔹 Gold is showing **bullish momentum** with higher highs and higher lows.
🔹 Price is testing **4850 resistance**, facing short-term selling pressure.
🔹 A small pullback is possible before attempting a **break above 4850**.
🔹 **12 EMA above 52 EMA** keeps the overall trend bullish. 📈
💡 Bias: Buy on dips / breakout confirmation
免責事項:本記事で述べられている見解は著者の見解のみであり、Followmeの公式見解を反映するものではありません。Followmeは、提供された情報の正確性、完全性、信頼性について一切責任を負いません。また、書面で明示的に記載されている場合を除き、本記事の内容に基づいて行われたいかなる行動についても責任を負いません。

